Chart USD/ZAR Update: Consolidating - background studies rising

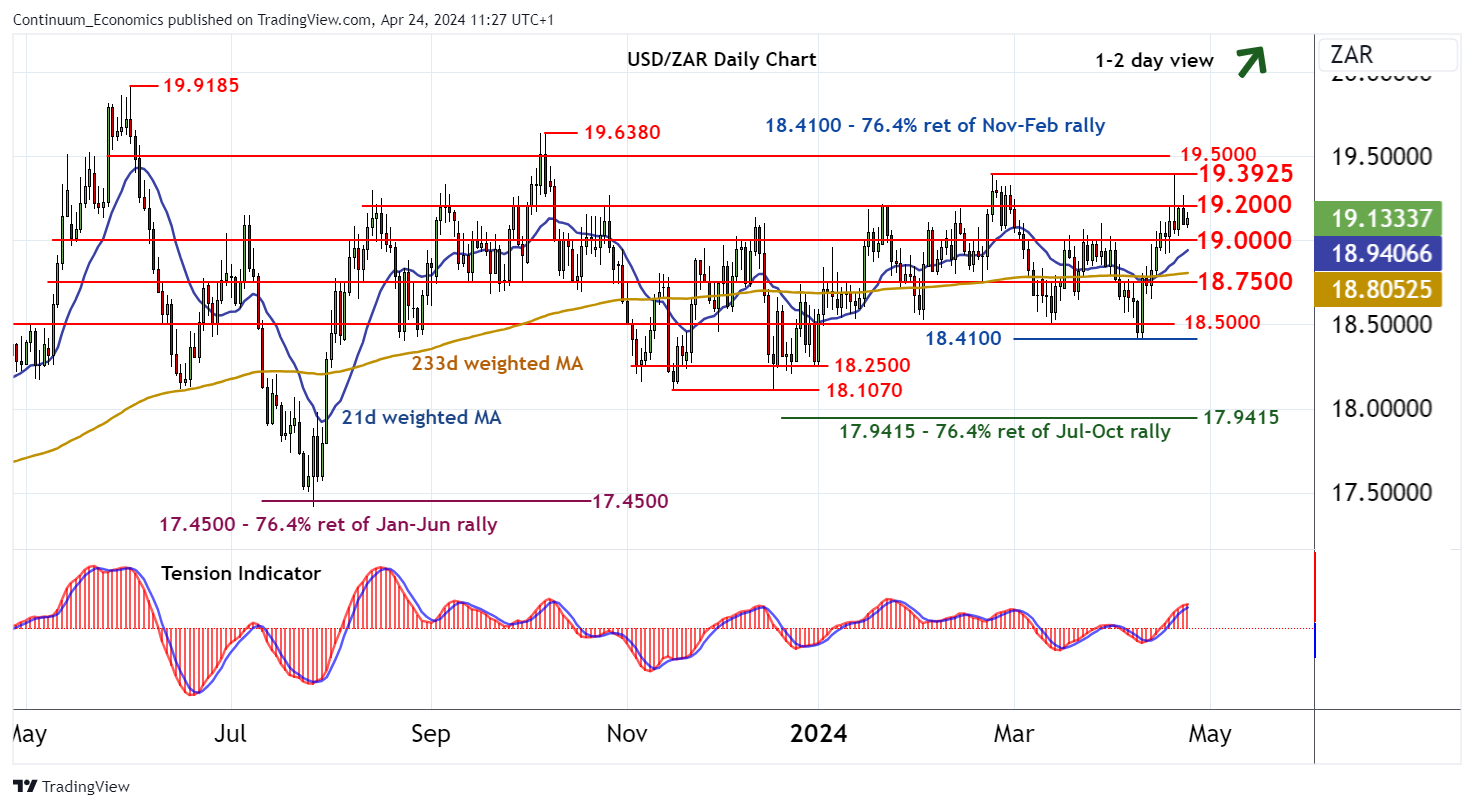
The test of resistance at 19.2000 has not been sustained
| Levels | Imp | Comment | Levels | Imp | Comment | |||
| R4 | 19.6380 | ** | 6 Oct (m) high | S1 | 19.0000 | * | congestion | |
| R3 | 19.5000 | ** | congestion | S2 | 18.7500 | * | congestion | |
| R2 | 19.3925 | ** | 23 Feb YTD high | S3 | 18.5000 | ** | congestion | |
| R1 | 19.2000 | break level | S4 | 18.4100 | ** | 76.4% ret of Nov-Feb rally | ||
Asterisk denotes strength of level
11:20 BST - The test of resistance at 19.2000 has not been sustained, with mixed intraday studies turning near-term sentiment cautious and prompting consolidation beneath here. Positive daily readings are also flattening, suggesting a cautious tone into the coming sessions. However, broader weekly charts are positive, pointing to potential for a later break back above 19.2000 and a test of strong resistance at the 19.3925 current year high of 23 February. A further close above here would confirm extension of November gains towards congestion around 19.5000. Meanwhile, support remains at congestion around 19.0000 and should underpin any immediate setbacks.