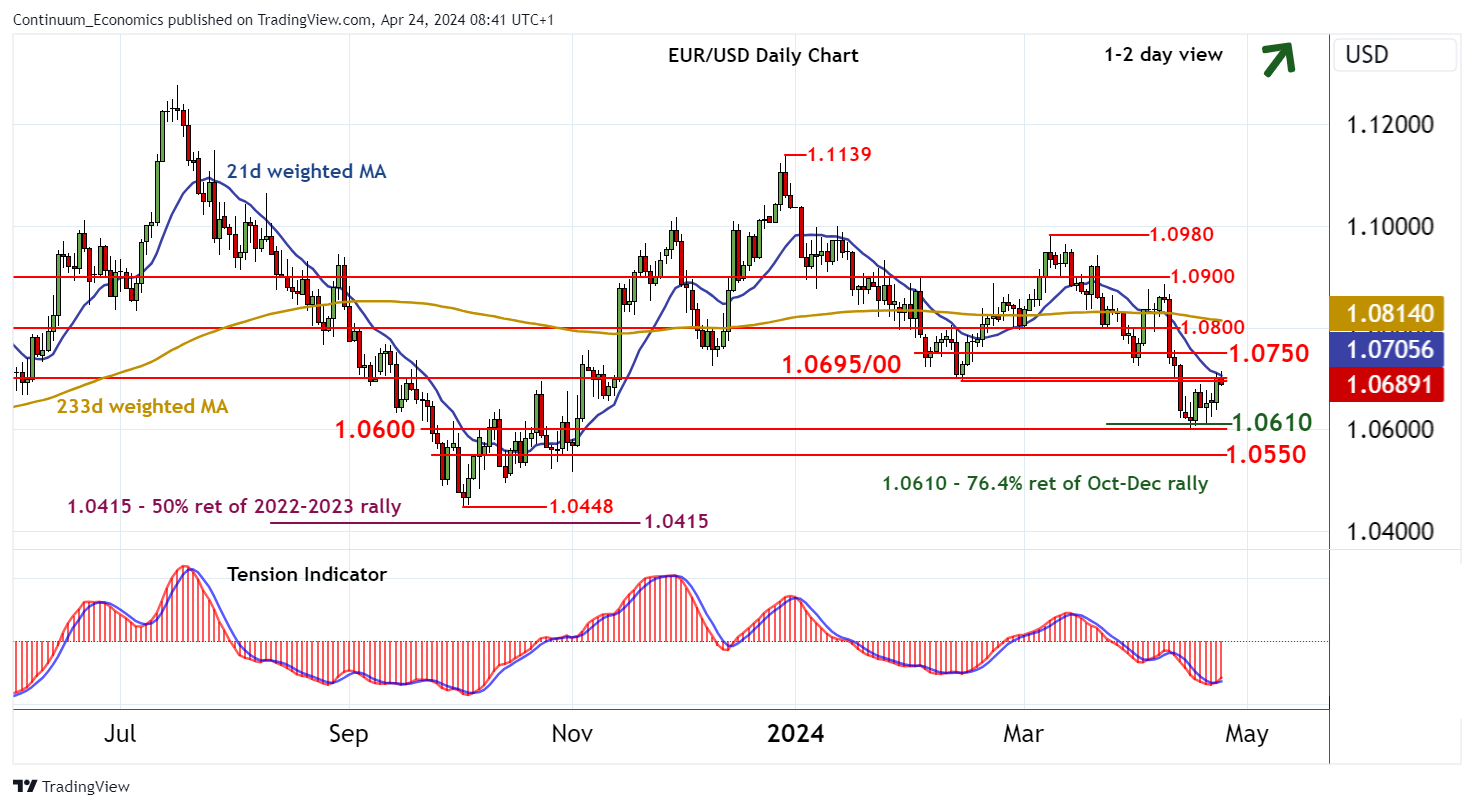
Chart EUR/USD Update: Consolidating test of 1.0695/00 - daily studies edging higher

Cautious trade has given way to the anticipated test of resistance at the 1.0695 monthly low of 14 February and congestion around 1.0600
| Levels | Imp | Comment | Levels | Imp | Comment | |||
|---|---|---|---|---|---|---|---|---|
| R4 | 1.0850 | congestion | S1 | 1.0600/10 | ** | congestion; 76.4% ret of Oct-Dec rally | ||
| R3 | 1.0800 | * | congestion | S2 | 1.0550 | * | congestion | |
| R2 | 1.0750 | minor congestion | S3 | 1.0515~ | * | 1 Nov (m) low | ||
| R1 | 1.0695/00 | ** | 14 Feb (m) low; congestion | S4 | 1.0500 | ** | congestion |
Asterisk denotes strength of level
08:35 BST - Cautious trade has given way to the anticipated test of resistance at the 1.0695 monthly low of 14 February and congestion around 1.0600, where unwinding overbought intraday studies are prompting short-term reactions. Daily stochastics and the daily Tension Indicator continue to rise, highlighting room for a break above here towards 1.0750. However, negative weekly charts are expected to limit any immediate tests in fresh selling interest/consolidation. Following cautious trade, price action is expected to turn lower once again. However, a close below congestion at 1.0600 and the 1.0610 Fibonacci retracement is needed to turn price action negative and extend late-December losses towards 1.0550.