Chart GBP/USD Update: Consolidating sharp gains - daily studies turning higher

Sharp gains have reached 1.2465, where unwinding overbought intraday studies are prompting short-term reaction
| Level | Comment | Level | Comment | |||||
|---|---|---|---|---|---|---|---|---|
| R4 | 1.2650 | * | congestion | S1 | 1.2400 | * | congestion | |
| R3 | 1.2600 | * | congestion, 50% ret | S2 | 1.2300 | * | congestion, 22 Apr YTD low | |
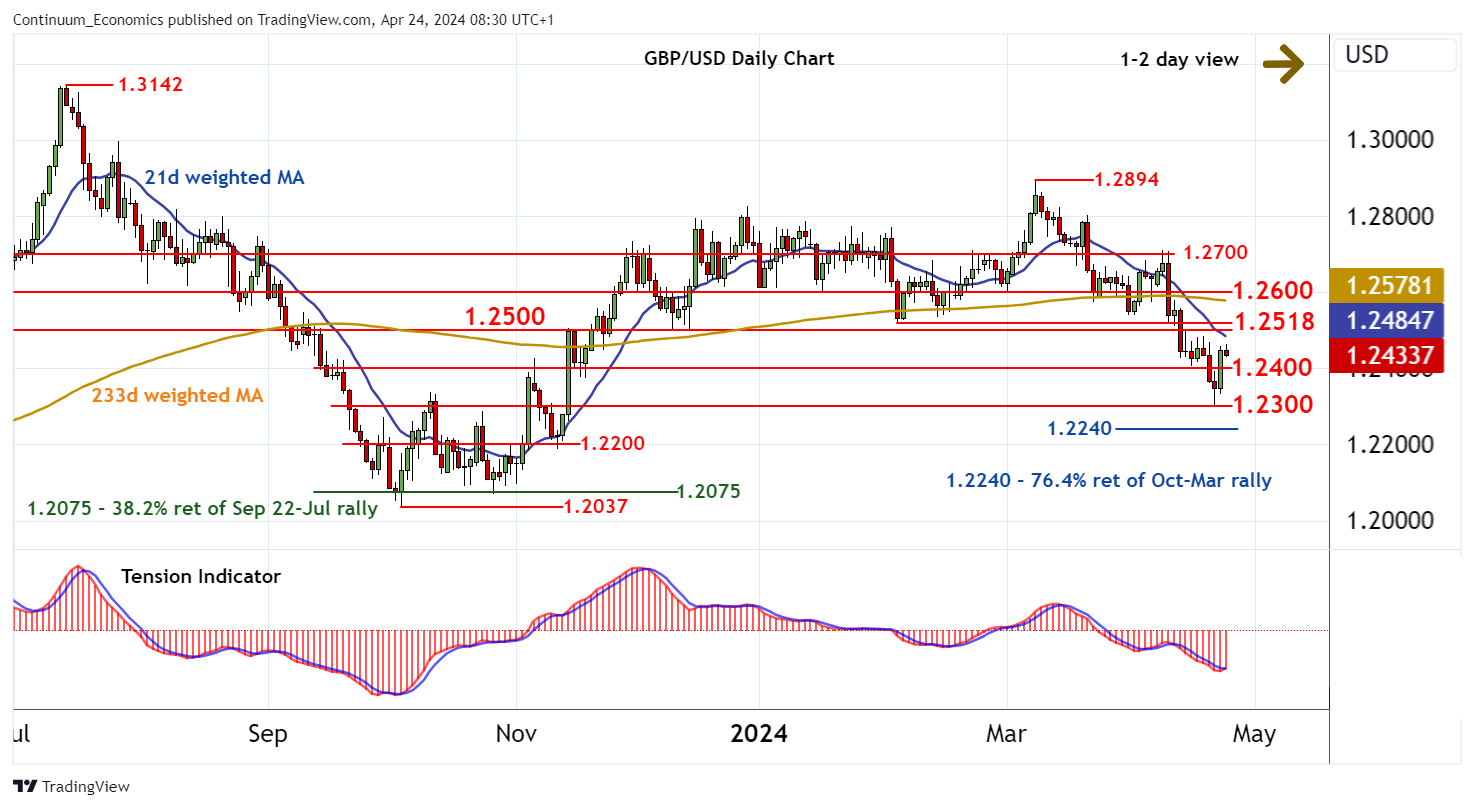
| R2 | 1.2530 | * | 38.2% ret of Mar-Apr fall | S3 | 1.2240 | ** | 76.4% ret of Oct-Mar rally | |
| R1 | 1.2500/18 | ** | congestion; 5 Feb (m) low | S4 | 1.2200 | * | congestion |
Asterisk denotes strength of level
08:05 BST - Sharp gains have reached 1.2465, where unwinding overbought intraday studies are prompting short-term reactions. However, oversold daily stochastics are unwinding and the bearish daily Tension Indicator is flattening, suggesting room for further gains in the coming sessions. Resistance is at congestion around 1.2500 and extends to the 1.2518 monthly low of 5 February. A close above here is needed to turn sentiment outright positive and confirm a more sustainable rally. Meanwhile, support is raised to congestion around 1.2400. A close beneath here would add fresh weight to sentiment and put focus back on critical support at 1.2300.