Published: 2024-04-24T03:36:32.000Z
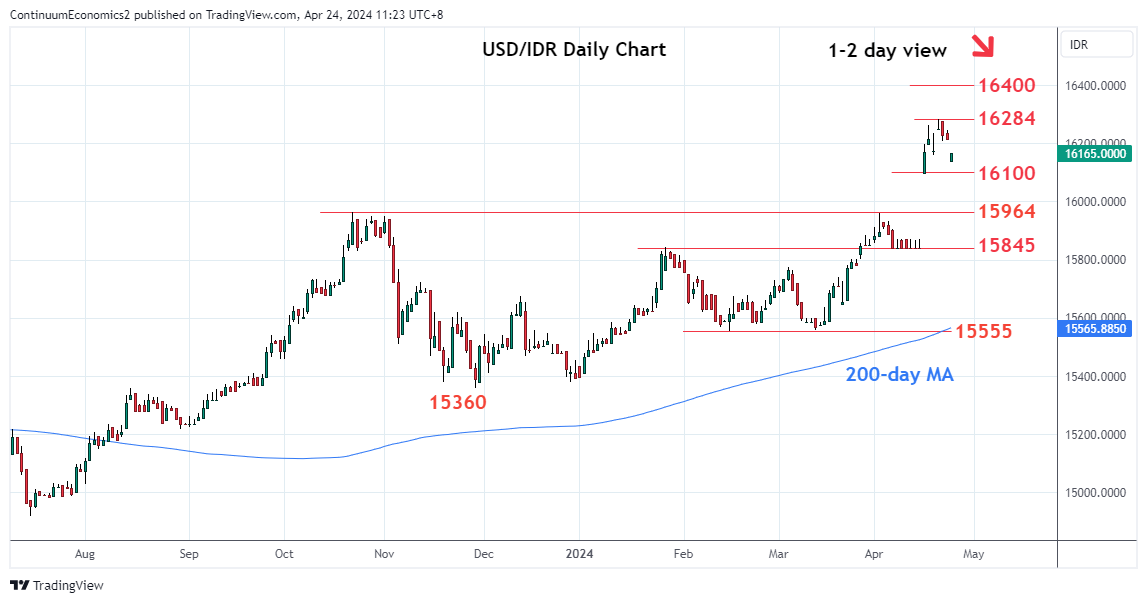
Chart USD/IDR Updates: Under pressure, room to the 16100/16000 area

Technical Analyst
1
Break of the 16159 support extending pullback from the 16284 high
| Levels | Imp | Comment | Levels | Imp | Comment | |||
|---|---|---|---|---|---|---|---|---|
| R4 | 16565 | * | 6 Apr 2020 high | S1 | 16100 | * | 16 Apr low | |
| R3 | 16400 | * | congestion | S2 | 16000 | * | figure | |
| R2 | 16284 | ** | 19 Apr YTD high | S3 | 15964 | ** | 23 Oct 2023 year high | |
| R1 | 16209 | * | 22 Apr low | S4 | 15845 | * | Jan high, congestion |
Asterisk denotes strength of level
03:30 GMT - Break of the 16159 support extending pullback from the 16284 high as prices unwind the deep overbought daily studies. Lower will see room for deeper pullback to the 16100 then the strong support at the 16000 level and 15964, the 2023 year high. Break of the latter will fade the upside pressure and turn focus lower to correct gains from the May 2023 year low. Lower will see room to retest the 15845, January high. Meanwhile, resistance is lowered to the 16209 and this should now cap and sustain losses from the 16284, April YTD high.